Plain MoneyUmnotfo Ebantfwini

11 charts

Charts

Every chart the column has run, newest first, with the argument it was drawn to carry.

How old a child born this year will be when income has doubled Age reached when income per person has doubled, at each country's average pace since 1990 Age of the child, years Source: World Bank, World Development Indicators; Plain Money calculation Plain Money / Mlungisi Ndwandwe 0 5 10 15 20 25 30 35 40 Vietnam 13 Mauritius 21 Rwanda 22 Eswatini 36

The economy · № 18 · 11 Oct 2026

Tiny, but mighty

At the pace of the past 35 years, a liSwati child born today will be 36 before the average income has doubled. A Mauritian child will be 21, a Vietnamese child 13.

Chart · Plain Money / World BankRead the edition →
Fifteen years of following Pretoria, never more than 75 points apart Central Bank of Eswatini discount rate and South African Reserve Bank repo rate, per cent, January 2011 – September 2026 Source: Central Bank of Eswatini monetary policy statements; South African Reserve Bank — Rate in force at month-end. Plain Money / Mlungisi Ndwandwe 2.5% 5% 7.5% 10% 0% Jan-11 Nov-12 Sep-14 Jul-16 May-18 Mar-20 Jan-22 Nov-23 Sep-26 75 points below SARB repo 7.25% CBE discount 7%

The economy · № 17 · 4 Oct 2026

Price of the peg

The Bank has let the gap open when South Africa tightened for its own reasons, and closed it when the rest of the world tightened too. September kept it at 25 points rather than letting it widen.

Chart · Plain Money / Central Bank of Eswatini; South African Reserve BankRead the edition →
Growth is forecast to peak this year, then settle near 2.6% Real GDP growth, 2014–2025, and the Ministry of Economic Planning and Development's September 2026 forecast (dashed) Source: Central Statistical Office; Ministry of Economic Planning and Development, September 2026 — 2028–2031 drawn at the forecast's stated average. Plain Money / Mlungisi Ndwandwe -5% 5% 10% 0% 2014 2016 2018 2020 2022 2024 2026f 2028f 2031f 2023, then 8.3% in 2024 2025 was forecast at 2.3% in Actual 4.8% Forecast

The economy · № 16 · 27 Sep 2026

The economy is growing. Can you feel it?

The jagged line is what happened; the dashed one is the plan. The ministry’s own forecast for 2025 went from 2.3% to 8.3% before the year came in at 4.8%, so read the tail as a direction, not a promise.

Chart · Plain Money / Ministry of Economic Planning and DevelopmentRead the edition →
Spring is surplus season: exports peak from September to November Merchandise exports less imports, monthly, September 2023 – August 2026, E billion. Shaded: September to November, when sugar and chemical exports peak. Dashed rule: the average Source: Eswatini Revenue Service, Monthly Merchandise Trade Statistics, Sep 2024 – Aug 2026 — August 2026 preliminary. Plain Money / Mlungisi Ndwandwe Average +0.1 -1.0 -0.5 +0.5 +1.0 +0.0 Sep-23 Jan-24 May-24 Sep-24 Jan-25 May-25 Sep-25 Jan-26 Aug-26 Sep–Nov Sep–Nov Sep–Nov Balance, E bn +0.2

The economy · № 15 · 20 Sep 2026

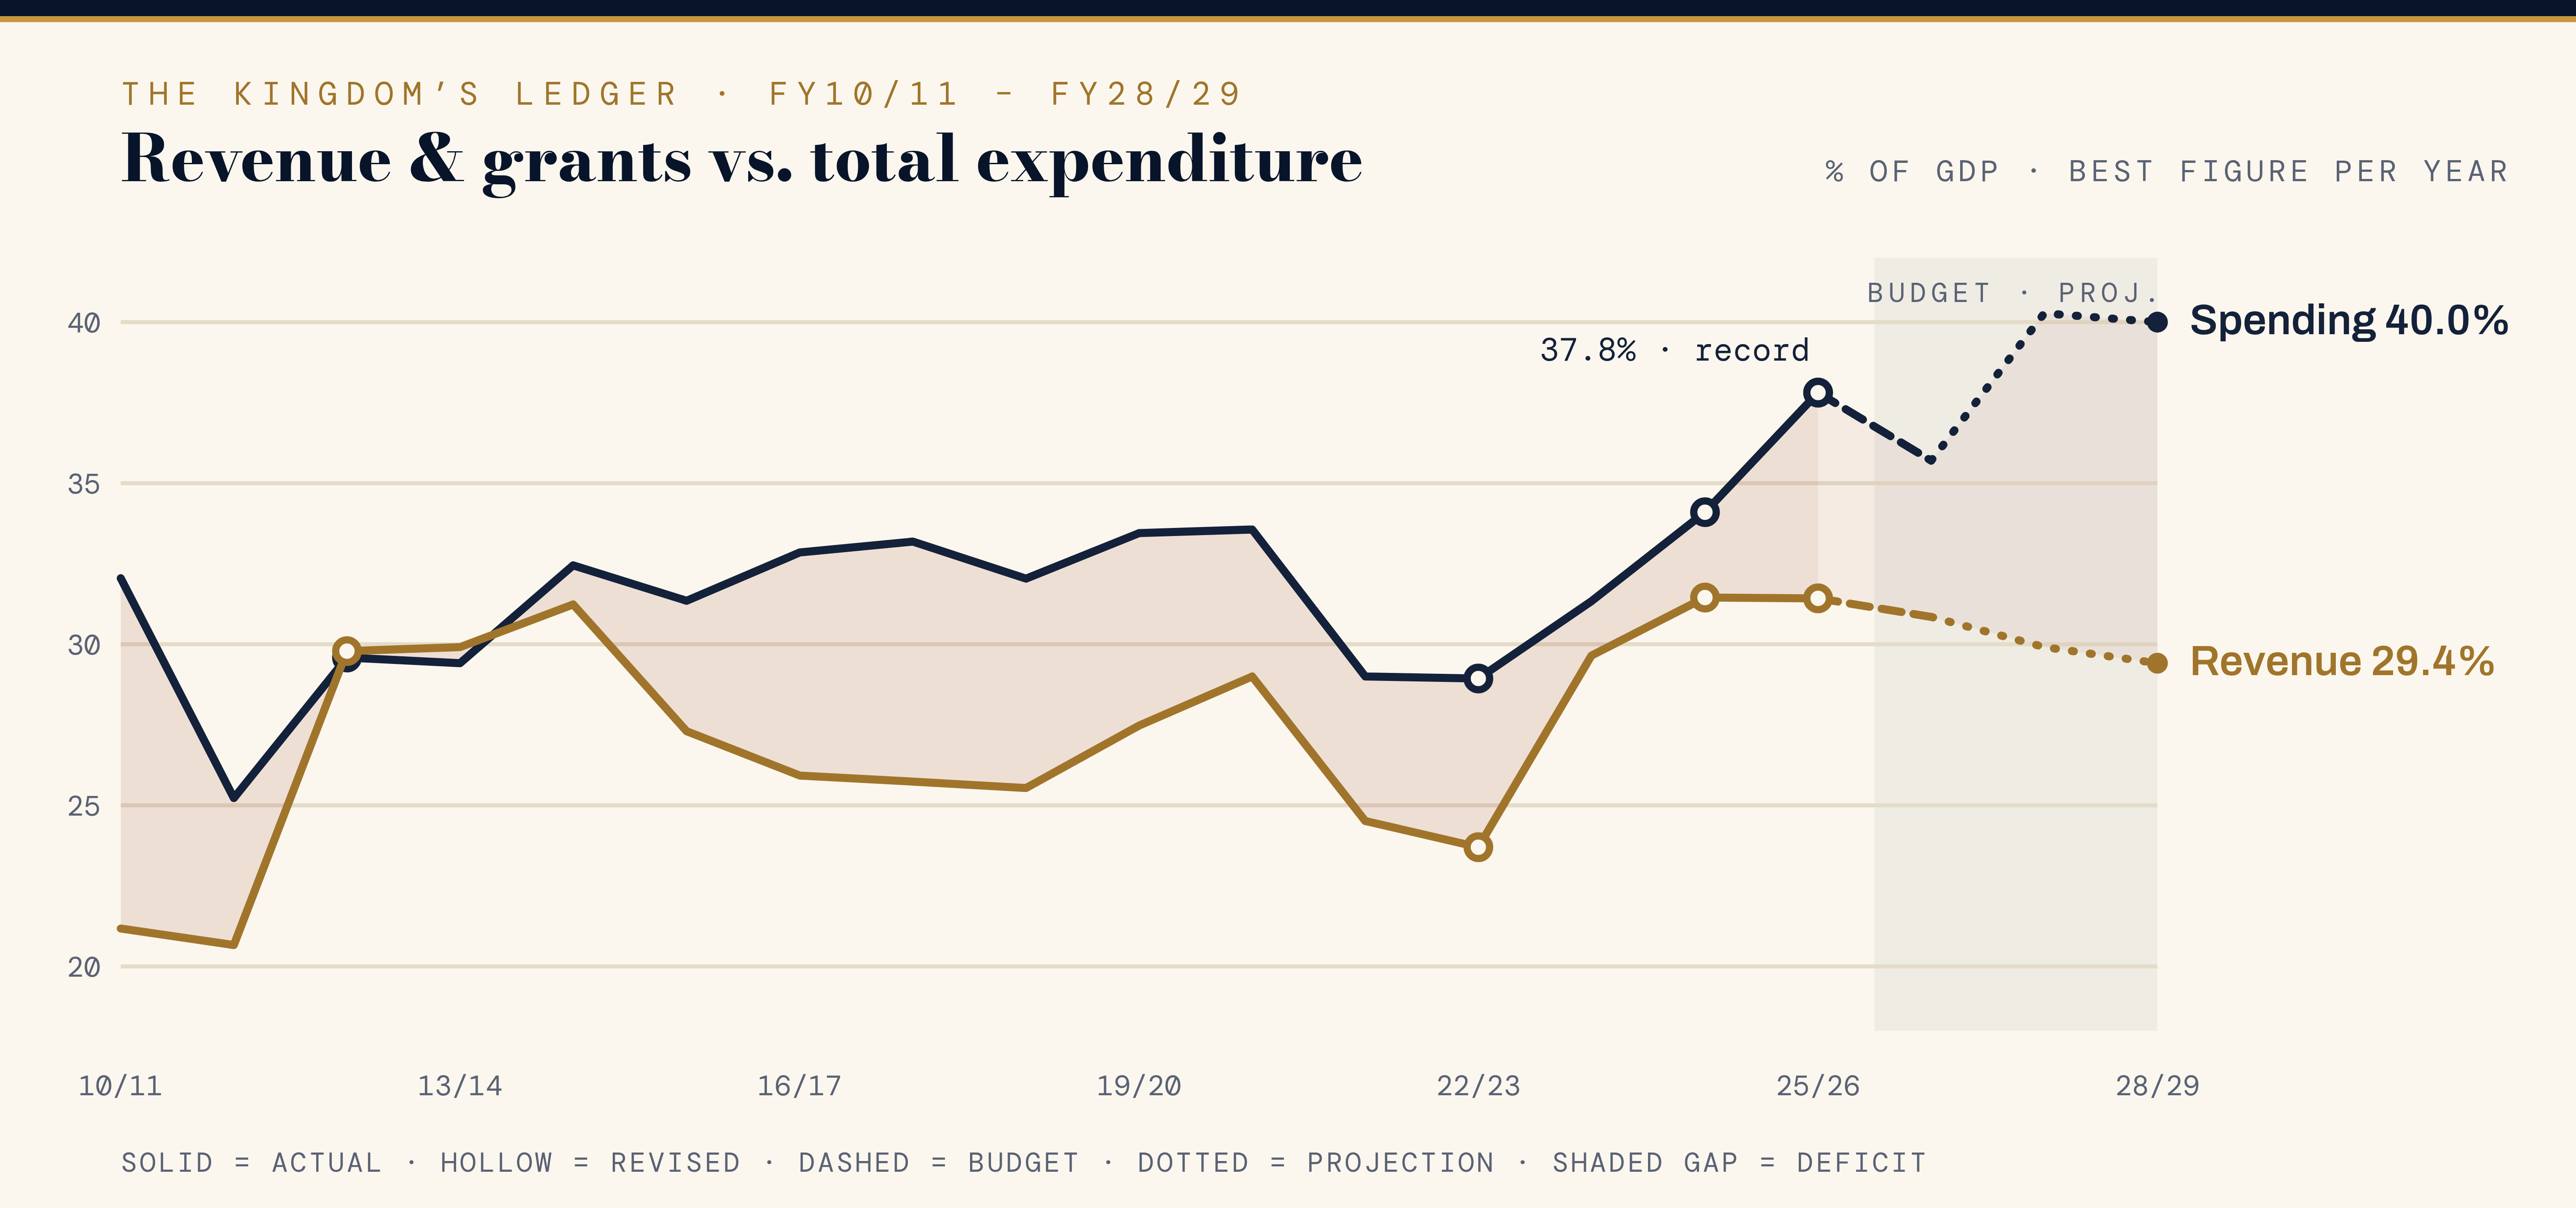
Where does our money go?

The April to August deficit is the shape of the year, not a verdict on it. Last winter’s shortfall had become a surplus by March, and the balance has ended the year ahead in five of the last six.

Chart · Plain Money / Eswatini Revenue ServiceRead the edition →
Car loans take their biggest share of household debt in six years Motor vehicle loans as a share of household credit at the banks, July 2013 – June 2026. Dashed rule: the period average Source: Central Bank of Eswatini monthly statistical releases — Unpublished months omitted; figures rounded. Plain Money / Mlungisi Ndwandwe Average 15.9% 10% 20% 30% 0% Jul-13 Sep-15 Dec-17 Jul-19 Dec-20 Jun-22 Jun-23 Jun-24 Jun-26 Low point, July 2022: 11.4% Car loans 15.2%

Your money · № 14 · 13 Sep 2026

Envy is expensive

A decade of decline, then a climb. The car is the household debt growing fastest at the banks, and its share of what Emaswati owe is back at the long-run average.

Chart · Plain Money / Central Bank of EswatiniRead the edition →
Households are paying the personal loan and slipping on the mortgage Non-performing loans as a share of each loan book, quarterly. Housing and unsecured personal loans September 2020 – June 2024; all bank loans March 2014 – March 2026 Source: Central Bank of Eswatini, Financial Stability Reports 2017–2025; Quarterly Review and Integrated Annual Report 2025/26 — The loan-type breakdown was published once (Issue 8) and ends June 2024; all-loans readings after June 2025 are from the Bank's other publications. Plain Money / Mlungisi Ndwandwe 2.5% 5% 7.5% 10% 12.5% 0% Mar-14 Sep-15 Mar-17 Sep-18 Mar-20 Sep-21 Mar-23 Sep-24 Mar-26 Sep 2020: NPL reporting re-aligned; Covid relief to Dec 2021 Housing 9.6% All loans Unsecured

Your money · № 13 · 6 Sep 2026

First things first

The home is the debt Emaswati would be expected to protect first. Since 2022 it is the one falling furthest behind, while the personal loan keeps getting paid.

Chart · Plain Money / Central Bank of EswatiniRead the edition →
Bad loans doubled in the drought years and never came back Commercial banks' non-performing loans as a share of total gross loans, quarterly, March 2014 – June 2025. Solid rule: the 5% CMA threshold Source: Central Bank of Eswatini, Financial Stability Reports 2017–2025 — Stitched across editions; Sep-2020 fall partly reflects a re-aligned NPL reporting framework. Plain Money / Mlungisi Ndwandwe Average 7% 0% 2% 8% 10% 12% 5% Mar-14 Jun-15 Sep-16 Dec-17 Mar-19 Jun-20 Sep-21 Dec-22 Mar-24 Jun-25 Drought & inflation Covid relief NPL ratio 7%

The economy · № 12 · 30 Aug 2026

The cost of a dry summer

The last strong El Niño reached the banks and stayed: a decade after the 2015/16 drought, bad loans have never returned below the 5% threshold.

Chart · Plain Money / CBE Financial Stability ReportsRead the edition →
Sharp blade: The structural shift in household credit Housing, motor vehicle and unsecured personal loans as a share of household credit, July 2013 – June 2026 Source: Central Bank of Eswatini monthly statistical releases — Unpublished months omitted; figures rounded. Plain Money / Mlungisi Ndwandwe 20% 40% 60% 0% Jul-13 Sep-15 Dec-17 Jul-19 Dec-20 Jun-22 Jun-23 Jun-24 Jun-26 Pandemic acceleration Housing loans 43% Unsecured loans 41% Motor vehicle loans 15%

Borrowing · № 11 · 23 Aug 2026

Borrowing with purpose

The lines almost touch: housing and unsecured credit as shares of what households owe.

Chart · Plain Money / CBE monthly statistical releasesRead the edition →
The ratio fell. The debt did not. Index, March 2024 = 100 Source: CBE Annual Economic Review 2024/25 Plain Money / Mlungisi Ndwandwe 85 90 95 105 110 100 Mar-24 Jul-24 Nov-24 Mar-25 GDP rebased Debt stock 105 Debt-to-GDP ratio 96

The economy · № 10 · Part I · 9 Aug 2026

Does Eswatini have a debt problem?

Five percentage points vanished in a month. Nothing was repaid — the economy was re-measured.

Chart · Plain Money / CBERead the edition →
The countries that defaulted are not the ones with the most debt. General government gross debt, per cent of GDP, 2025 Source: IMF World Economic Outlook, Oct 2025 — General government gross debt. Years mark sovereign defaults. Plain Money / Mlungisi Ndwandwe Japan 230% Mozambique ’16 131% Zambia ’20 115% Sri Lanka ’22 101% South Africa 77% Namibia 64% Ghana ’22 59% Lesotho 57% Ethiopia ’23 47% Eswatini 43% Botswana 39%

The economy · № 10 · Part I · 9 Aug 2026

Does Eswatini have a debt problem?

Five of these countries defaulted. They are not the five carrying the most debt.

Chart · Plain Money / IMF WEORead the edition →

Get each edition by email

Every column, the Sunday it prints in the Sunday Observer.

Free · every Sunday · unsubscribe anytime